The unemployment rate in the U.S. has been steadily declining since it hit 10 percent in October 2009. Four and a half years of steady and consistent improvement in the unemployment rate, however, has convinced neither policymakers nor the public that the American labor market is on track for a comeback. At the end of 2012, then-Chairman Bernanke announced that the Federal Reserve will consider raising interest rates once the unemployment rate hits 6.5 percent, implying a vote of confidence in the strength of the labor market and economy at that threshold. As of February 2014, the unemployment rate stands at 6.7 percent, and the Federal Reserve has essentially abandoned the 6.5 percent threshold as a full labor market recovery is yet to be seen.
How would one then see if such a recovery is truly underway? Other indicators in addition to the unemployment rate can help explain more clearly where the improvements and challenges are in the U.S. labor market. Among others, the employment-to-population rate, labor force participation, duration of unemployment, and broader measures of the unemployment rate help explain why there is still excess capacity (slack) in the labor market despite improvements in the unemployment rate. First, let’s look into the improvements and note some of the progress that has been made. Then, let’s zoom in further to see where the challenges lie ahead.
Let’s first take a look at the unemployment rate together with the employment-to-population rate to see if they tell the flip side of the same story. From the start of the chart below all the way through 2010, when the unemployment rate began its recent downward trend, the employment-to-population (E/P) rate and the unemployment rate (which is a share of the labor force) have moved very closely together. When unemployment rises, employment falls almost in unison. This pattern breaks right around the time when the unemployment rate hits its peak and the E/P rate stops its decline. From that point through this last month, the unemployment rate has continued to decline but the E/P rate has barely budged.
U.S. Unemployment Rate and Employment to Population Rate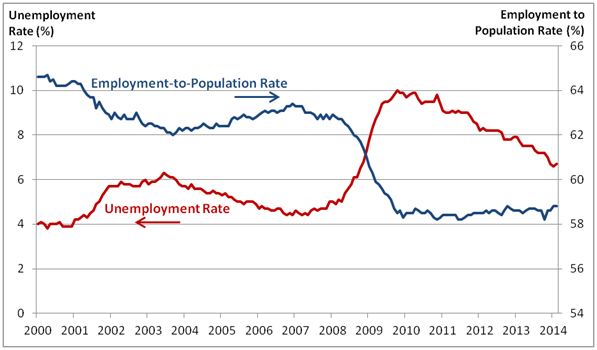 Source: Bureau of Labor Statistics
Despite a declining unemployment rate and 7.6 million jobs added to the economy since employment bottomed out in February 2010, the E/P rate has remained flat, signalling a much weaker labor market than the unemployment rate suggests. After all, unlike the unemployment rate, the E/P is not affected by discouraged workers who leave the workforce believing that they have little to no prospects of getting a job. On the other hand, the E/P rate is affected by changing demographics: the American workforce and population are getting older, and the older you get after your peak employment years, the lower your employment rate profile. Samuel Kapon and Joseph Tracy at the New York Fed have estimated the trend in the E/P rate, adjusted for changing demographics, and found that the E/P rate would be declining regardless of business cycle fluctuations due to an aging American population. In essence, a stable E/P rate over the last couple years is, to a certain extent, a positive sign in-so-far as it has kept from declining further. Although the 7.6 million added jobs since February 2010 is not quite enough to bring the U.S. back to full employment, the non-increasing E/P rate is not as bad of a signal as it seems, showing some improvements in the labor market to help support the story that appears to be provided by the declining unemployment rate.
So what then of changes to the labor force that affect the unemployment rate? The labor force participation rate, which measures the size of the labor force relative to the size of the working age population, recently hit a 35-year low at 62.8 percent, leaving many to point towards the rise in discouraged workers leaving the labor force as an explanation. It turns out that, much like the story behind the flat E/P rate, an aging population is the primary reason for workers exiting the labor force since the start of recession in 2007. The chart below, taken from a blog post by Ellyn Terry at the Atlanta Fed, breaks down the rise in the not-in-labor-force to show that those who exited the labor force who say they want a job contribute only 11 percent to the total change. The primary driver of the decline in labor force participation from the start of the recession in 2007 through the end of last year has been retirement, followed by the number of people who are disabled/ill or in school.
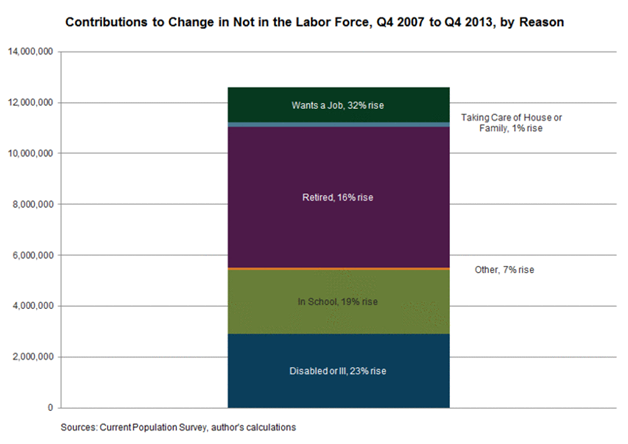 Source:January 17th “Macroblog” entry by Ellyn Terry at the Atlanta Fed
Shifting demographics could help explain how a stubbornly flat E/P rate can be seen as an at least modest improvement in employment conditions, and could also explain the largest single driver of the decline in the labor force participation rate. It is also important to note that although those who want a job contributed only 11 percent to the rise of those not in the labor force over this period, they were the fastest growing group at 32 percent.
Zooming in further to understand more about the nature of unemployment and employment for those who are indeed unemployed or employed, the challenges and worrisome aspects of the U.S. labor market begin to become clear.
Picking up on those who left the labor force but still want a job, comparing a broader measure of the unemployment rate that includes many of those people with the traditional unemployment rate shows us how the economy has been much slower at absorbing those workers than before the crisis. Specifically, the U-6 measure of unemployment includes discouraged workers and “marginally attached” workers who have looked for work in the last year but not in the last four weeks (both groups not recorded as officially unemployed because they are not recorded in the labor force) along with part-time workers who are part-time for economic reasons but would rather be full-time. By construction, the U-6 unemployment rate is always higher than the traditional U-3 unemployment rate, and they have moved in the same direction, before and after the recession. As noted by Dave Altig at the Atlanta Fed, “marginally attached” workers have been moving into the labor force at the same rate as before the recession, but the transition from marginally attached to the labor force to employed has been much slower in recent years than historically. Looking at the difference between U-6 and U-3 before and after the recession shows how the economy has not yet undone the jump in marginally attached workers and people working part-time for economic reasons that occurred during the recession, although the difference has begun to decline.
U-6 Unemployment Rate minus U-3 Unemployment Rate  Source: Bureau of Labor Statistics (Note: 3 month moving averages)
Sticking to the traditional U-3 unemployment rate for a moment, a look into the duration of unemployment brings to light the increased share of the long-term unemployed out of the total unemployed. In 2009 alone, this share jumped from 22.6 percent in January to 40.4 percent in December, reaching its peak of 45 percent in September 2011, before gradually declining to 37 percent last month. To put this in perspective, the share of the long-term unemployed was 16.3 percent at the start of 2007, and just under 10 percent in 1990. The concern with long-term unemployment is that the longer the time spent without a job, the harder it becomes to get one, raising the fear of permanent unemployment that becomes structurally embedded in the economy.
Zooming in on the employment side also reveals some worrying features, namely the growing share of part-time employment, especially that which is due to economic reasons. Just before the recession in 2007, part-time workers as a share of total employed stood at 17 percent before jumping 3 percentage points to 20 percent at the start of 2010, now standing at close to 19 percent. A 3 percentage point increase is the highest increase since the early 1990s at least. Of those part-time workers, 26 percent would rather have full-time jobs, an improvement from 33.7 percent in March 2009, but still higher than the 13 percent level at the start of 2000.
It is no surprise, then, that the Federal Reserve abandoned its threshold of a 6.5 percent unemployment rate to begin considering a policy rate liftoff (raising interest rates as the economy strengthens). The unemployment rate is now close to 6.5 percent, but worrisome figures on the long-term unemployed, the marginally attached to the labor force, and the increased importance of part-time employment for economic reasons present obstacles in achieving full employment. Demographic shifts and an aging population help show that not all of the decline in labor force participation and of the stubbornness of the employment-to-population rate are due to discouraged workers, illustrating some improvements in labor market conditions.
Other indicators not discussed here, such as hours worked, wages and productivity are also part of the larger story of the U.S. economy as a whole. In fact, these indicators in particular are also of a larger story on globalization, technology, jobs, and income equality – certainly a topic for another day here at the Record.
